According to the latest data from the Canadian Real Estate Association (CREA), housing market conditions across Canada resulted in a new record for home sales in January, with 36,897 homes changing hands; a 35.2% increase on a year-over-year (y-o-y) basis.
By comparison, new listings dropped nationally by 2.9% y-o-y, with just 52,342 properties being added to the market last month. As such, the overall housing market was highly competitive for homebuyers in January, as indicated by the sales-to-new-listings ratio (SNLR) of 70%. The SNLR is a measure of marketing competition during a defined period of time and is calculated by dividing sales by the total number of new listings added to the market during that time. A number over 60% depicts a seller’s market: where demand outpaces supply and competition conditions favour home sellers over buyers.
According to CREA, as the spring market approaches, the current pace of home sales growth might be inhibited by an evident lack of supply, particularly in Ontario markets, to meet growing home buyer demand. However, CREA notes that new supply “could materialize as current COVID-19 restrictions are increasingly eased and the weather starts to improve.”
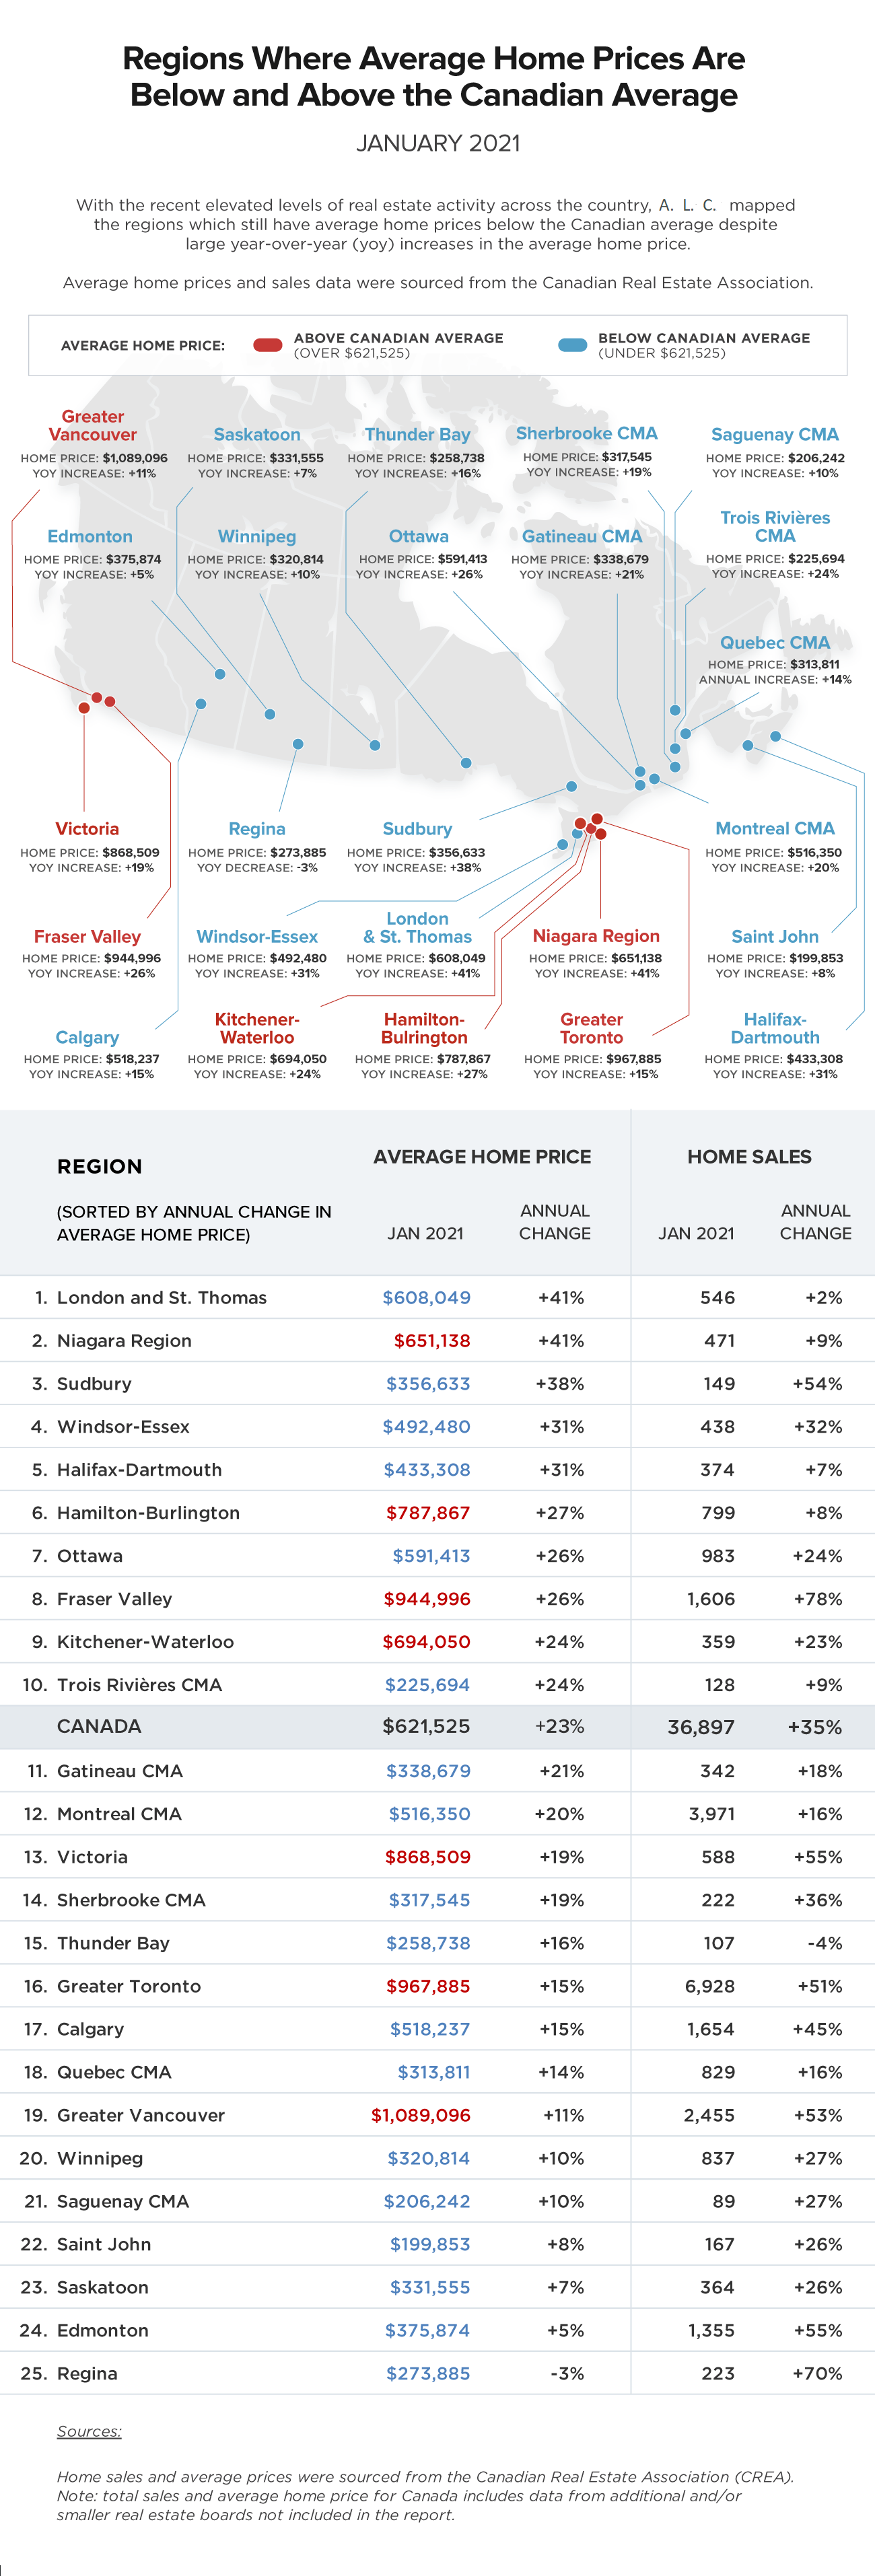
Prevalent market conditions in January also put upward pressure on home prices: the national average home price rose 23% annually in January to $621,525. To better understand where home buyers may find pockets of affordability, Agent Listing Campaign took a closer look at the average home price in each of the 25 regional housing markets covered in CREA’s monthly report and ranked every market based on the annual rate of growth of the average home price. We also identified where the average home price fell below and above the national average home price and curated a list of example homes in each market that sold within a $20,000 range of the average home price.
Of the 25 regional housing markets included in CREA’s monthly report, 24 markets posted a y-o-y increase in the average home price, ranging from 5% to 41%, and just one market – Regina – saw the average home price decreased by 3% to $273,885. Further, 12 housing markets, or almost half of the areas included in the report, posted growth in the average home price of at least 20%.
Average Home Price Below National Average in 18 of 25 Regional Markets Across Canada
Despite strong annual growth in the average home price in nearly every market, the average home price remained below the national average of $621,525 in 18 markets.
Saint John took the title of Canada’s most affordable housing market in January, despite an 8% increase in the average home price y-o-y to 199,853. On the other hand, Greater Vancouver recorded the highest average home price in January at $1,089,096 – an 11% increase y-o-y.
Despite trying for the highest increase in the annual average home price at 41%, the average home price in London and St. Thomas remained below the national average at $608,049. There was also a 41% increases y-o-y in the Niagara Region, however, the average home price clocked in at $651,138, nearly $30,000 higher than the national average.
Check out our infographic below highlighting the average home price in 25 regional housing markets across Canada, and where the average home price is above or below the national average. Further below find a sampling of home listings available in each region where the average home price is below the national average.


